Welcome to Mason Schneider's Math Project, in this project I am "Growing" carrots for a community garden, for the first part of this project I made this function table. It has the selling price for a number of carrots 1-6 and 600.
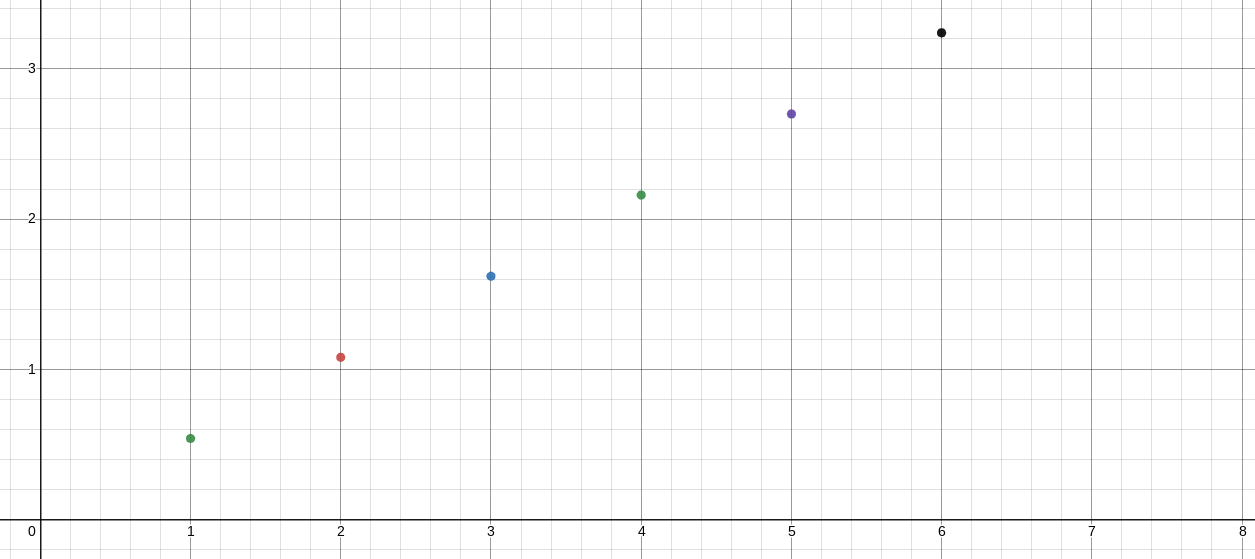
I then graphed the data from the table to make this graph ⇓
x is the number of carrots sold and y is the profit. (y is the vertical line across the left side and x is the horizontal line at the bottom (Me mum told me to include this))
Welcome to section two, in this section I am to determine the costs of buying tools and seeds for my carrots, and then the selling price for my carrots.
Materials list:
Ames Welded Garden Hoe - $17.98
Continental Premium 5/8 in. Dia x 50 ft. Commercial Grade Rubber Black Water Hose - $29.27
Green Edge 40 lb. 6-2-0 Slow Release Organic Fertilizer -Lawn and Garden Fertilizer. Covers 3200 sq. ft. - $25.97
I'm thinking on selling my carrots for about 55 -> 58 cents. I'll go even with myself, $0.57.
Welcome to section 3, here I am to make a linear function to represent my profit, describe what the variables represent, and graph as well as describe the function.
Linear Function:
c = # of carrots; p = profit;
p = 0.57c
The 0.57 is the selling price of my carrots, the c is the amount of carrots I sell. The p is the then estimated profit based on the amount of carrots I produce/sell.
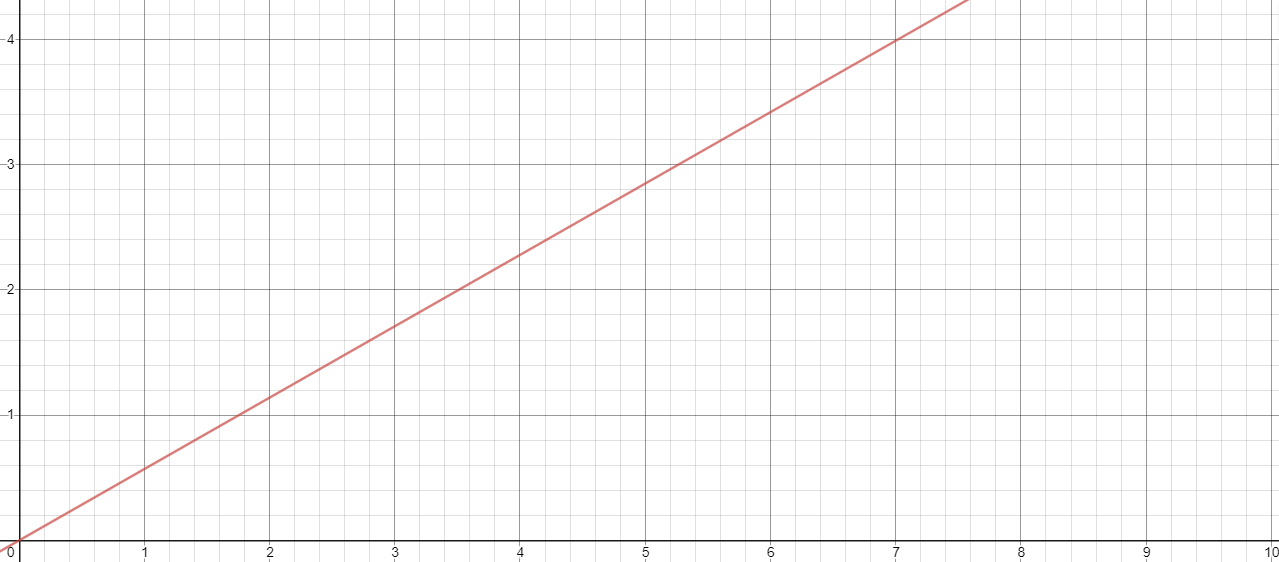
Below I have my linear function, graphed.
(y is the vertical line across the left side and x is the horizontal line at the bottom (Me mum told me to include this))
As you can see on the graph after 1 carrot(x) the profit(y) increases by just above half, or to be exact 0.57. (e.g. p = 0.57c | 2.85 = 0.57 * 5)
In section 4 I will research gross profit, total revenue, and gross profit margin. Then I will make a diagram explaining these terms. After that I will find my gross profit margin based on my estimated gross profit and total revenue, and what my gross profit tells me.
Gross Profit: In accounting, gross profit or sales profit or gross margin is the difference between revenue and the cost of making a product or providing a service, before deducting overhead, payroll, taxation, and interest payments. Note that this is different from operating profit. Note also that gross margin is the term normally used in the U.S., while gross profit is the more common usage in the UK and Australia.
Total Revenue: Total revenue is the total receipts a seller can obtain from selling goods or services to buyers. It can be written as P × Q, which is the price of the goods multiplied by the quantity of the sold goods.
Gross Profit Margin: The gross profit margin (also known as gross profit rate, or gross profit ratio) is a profitability measure that shows the percentage of gross profit in comparison to sales. In other words, it calculates the ratio of profit left of sales after deducting cost of sales.
My calculations:
Estimated Production Number: 627
Estimated Number of Sales: 533
Estimated Gross Profit: $231.94
Estimated Total Revenue: $303.81
Estimated Gross Profit Margin: 43.5%
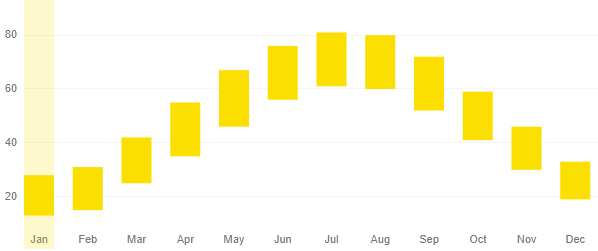
In this section I have my average temperatures for March 24 - April 7 (carrot planting season) and my qualitative graph that shows the change in temperature over the growing season. Including a brief explaination of my graph
March average temperature in Wisconsin: 42°F or 25°C
April average temperature in Wisconsin: 55°F or 35°C
You usually harvest spring planted carrots in the mid-summer, or when you believe they have grown to a good size. But you don't want them growing in too much heat, because then they grow too fibrous. Other than that, carrots are biennial, so if you don't harvest them they will plant their own seeds from the flowers and regrow.
In March the average temperature was 42°F (Wisconsin)
In April the average temperature was 55°F (Wisconsin)
In May the average temperature was 67°F (Wisconsin)
In June the average temperature was 76°F (Wisconsin)
In July the average temperature was 81°F (Wisconsin)
(The normal time to pick spring planted carrots is mid-summer, so I added May, June, and July to the list for the growth season time)
Sources: wallstreetmojo.com (home depot) walmart.com financial-dictionary.thefreedictionary.com www.accountingverse.com thebalancesmb.com almanac.com toptal.com-(for degree symbol) no Idea about the Qualitative Graph, all I know is that it said at the bottom "Data from Weather Trends"